Assessment 2 Model Answer
This is the model answer for Assessment 2. Multiple methods have been provided for answering some questions. There may be other valid methods for getting to the correct answer.
In marking the assessment, partial marks are given for working, and for error carried forward (ECF), where an answer is correct but for an incorrect value brought forward from an earlier question for which the student has already lost marks.
A demo of the model answer code is available on Replit. The test code that was used in marking the assessments is available on GitHub
Part 1: Statistics [ 40 marks ]
Statistics Program [ 16 marks ]
Background: Rather than doing statistics calculations by hand it is very common to use a program designed to do them automatically. However, they are complex and it is important to understand what they are doing ‘under the hood’ in order to avoid making mistakes in your analysis.
Task: You will write a simple statisitcal analysis program that performs an appropriate hypothesis test given a user’s input. A basic user interface has been written that asks the user a series of questions. The answers to these questions are passed to the following function. For more details of the questions the arguments relate to, examine public static void main(String[] args) in Main.java.
    /**
    * @param groups - the number of groups in the study = 1 or 2
    * @param popSD - population standard deviation for a one-group study, if known, else -1
    * @param comparisonValue - value to compare mean against in one-group study, else -1 for a two-group study
    * @param group1Values - numeric values for group 1
    * @param group1Values - numeric values for group 2, if a two-group study, else null
    * @param design - for two-group studies 1 = within groups, 2 = between groups, else -1 for a one-group study
    */
    public static void run(int groups,
                           double popSD,
                           double comparisonValue,
                           double[] group1Values,
                           double[] group2Values,
                           int design)
The content of this function will be marked. Other functions or classes referenced in this function will be marked. The content of public static void main(String[] args) will not be marked (you can replace it with other code if you wish, for example to speed up testing your code).
Assume all hypothesis tests are two-tailed.
- Select an appropriate statistical test to use for every valid input the user could give
- Determine whether the result was significant, calculating required intermediary variables
- Report the following information to the user:
- A summary of the options that were selected by the user [ 1 mark ]
- A summary of each group’s data, including: [ 3 marks ]
- Count
- Mean
- Median, upper and lower quartiles
- Standard deviation
- Statistical test used [ 2 marks ]
- Test statistic [ 2 marks ]
- Degrees of freedom (if appropriate) [ 2 marks ]
- Whether or not the result is significant at \( \alpha = 0.05 \) [ 3 marks ]
- An appropriate measure of effect size [ 2 marks ]
- Whether that effect size is small, medium or large according to conventional thresholds [ 1 mark ]
You may also report to the user any other information or justification for the choices made by the program if you feel it would be assist in the interpretation of the results.
You may find this table of z scores and this table of t scores helpful. In determining the critical threshold for a t score, you may restrict yourself to the degrees of freedom shown in the linked table. To perform a test with 35 degrees of freedom, for example, round down to 30, (which is shown in the table) to find the critical threshold for the test.
Hypothesis Test [ 10 marks ]
Background: Binaural audio is audio that it captures the spacial position of sound sources relative to the listener in the same way that the human ear is able to spacially locate sources of sound. It is now commonly available in AAA video games. Binaural audio can be recorded using a special binaural microphone or created in-game using digital signal processing techniques. Because of this it is hypothesised that it will improve immersion in Virtual Reality (VR) games.
An experiment was run to test the hypothesis that the use of binaural audio improves immersion in VR games compared to sterio audio. 30 adults were recruited using an opportunity sample from a university campus. Each participant filled in a consent form and questionnaire, then played a VR game for 30 minutes while listening to the game audio through headphones. Half (15) of the participants were assigned to a condition with binaural audio. The remaining participants were assigned to a control condnition with sterio audio. Afterwards all participants filled in the Immersive Experience Questionnaire (IEQ).
The full data is available here
Three hypothesis tests will be performed. It is expected that Real-World Dissociation and Emotional Involvement (components of the IEQ) will be most affected by binaural audio, therefore, the tests will be:
- the effect of binaural audio on total immersion score
- the effect of binaural audio on Real-World Dissociation
- the effect of binaural audio on Emotional Involvement
The overall alpha level of the experiment will be 0.05.
Task: You will test the hypothesis that binaural audio will affect total immersion score using a two-tailed test.
You may calculate the following by hand, or by using a statistics program or online calculator (including, for example, the one you have written for the question above).
Report the following:
- Appropriate statistical test to use, including formula [ 1 mark ]
- Test statistic [ 1 mark ]
- Degrees of freedom [ 1 mark ]
- Alpha level of test [ 1 mark ]
- P value [ 1 mark ]
- Whether or not result is significant [ 1 mark ]
- Effect Size [ 1 mark ]
-
Two-sample t-test, formula:
\( t = \frac{x_1 - x_2}{\sqrt{\frac{s^2_1}{n_1} + \frac{s^2_2}{n_2}}} \)
- t = 2.9714
- df = 30 - 2 = 28
- a = 0.05/3 = 0.0167 (reduced due to multiple testing by Bonferoni correction)
- p = 0.0060
- significant
- d = 1.08458993
Produce the following graphs:
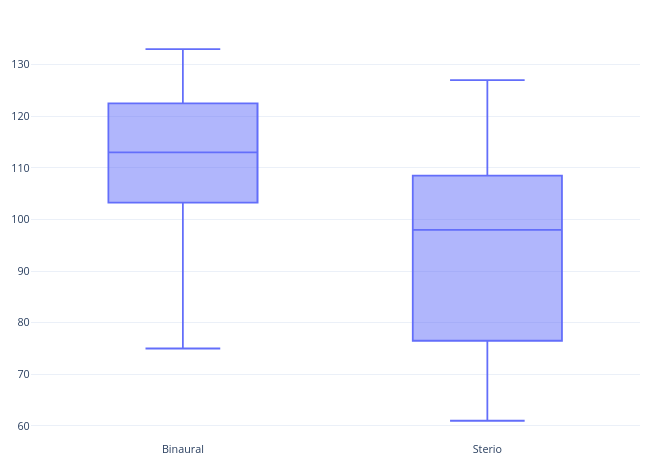
- Visualise this hypothesis test with an appropriate graph [ 1 mark ]
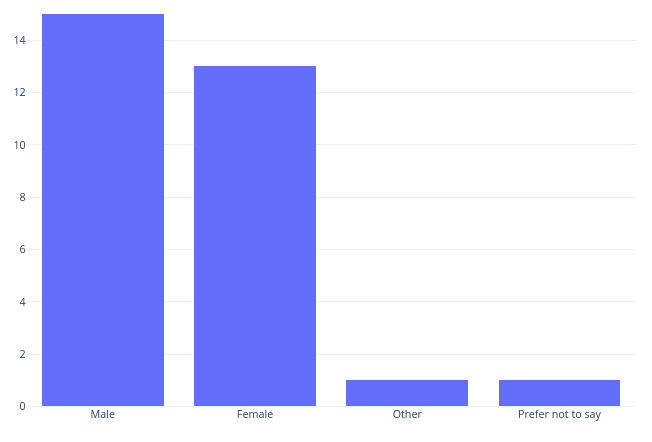
- Visualise the proportion of participants’ gender with an appropriate graph [ 1 mark ]
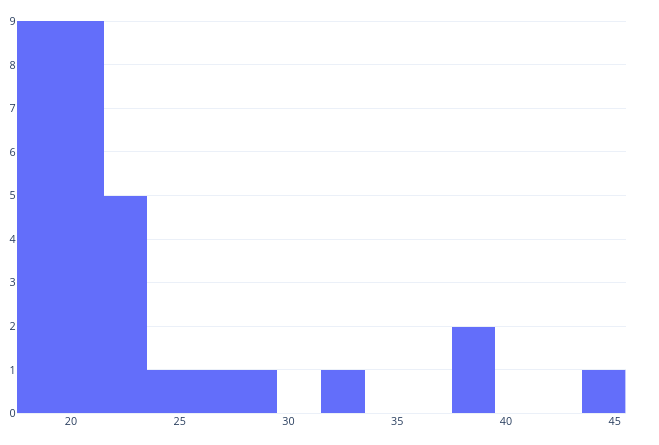
- Visualise the distributions of participants’ age with an appropriate graph [ 1 mark ]
Probability [ 14 marks ]
Background: Suppose I am designing a game. It is a 2 player game where opponents summon creatures and battle them against each other. I call it Poké-oh the Gathering. To aid the design of this game, I want to analyse certain probabilities. A summary of some fo the game rules is as follows:
Each player has a deck of cards. Each deck contains 40 cards. A card has three properties: type, cost, and strength. Each player also has a number of coin tokens, starting with 3. Play proceeds clockwise from the first player. On a turn you may play a card (if you can) to the BattleSpace. If you have cards in the BattleSpace at the start of your turn, there are other actions you may take (not relevant here). To play a card to the BattleSpace you must have enough coins (coins are not expended by playing cards).
A the beginning of the game, each player draws a hand of 5 cards from their deck. The order of cards in the hand does not matter. Then the first player takes their turn.
A table listing all of the cards can be found here
Task: Answer the following questions. To do so you may use an analytical approach and/or write a program to help you approximate an answer accurate within 2 decimal places. Either way, you must show your working (either stages of reasoning, or program code) to get the full marks.
- I draw a single card from a full deck of cards. I am interested in the event \( D_F \) of drawing a fire-type card and the event \( D_3+ \) of drawing a card of strength at least 3.[ 1 mark ]
- Illustrate these events with a venn diagram.
- What is \( P(D_F \cap D_3+) \)?
From the Venn diagram, we can see there are 3 cards in \( P(D_F \cap D_3+) \), out of a total of 40 cards that we could draw.
\( P(D_F \cap D_3+) = \frac{3}{40} = 0.75 \)
- In the game described above, how many different starting hands could be drawn? [ 1 mark ]
There are 40 cards in the deck, of which a combination of 5 are drawn.
\( ^{40}C_5 = 658008 \)
- What is the probability that a player is not able to play a card on their first turn? [ 2 marks ]
Total possible hands of 5 cards from a deck of 40: \( ^{40}C_5 = 658008 \)
If we take out all cards costing 2 or 3 from deck, we have a deck of 24 cards. We can find how many possible hands we can make without using a card costing 2 or 3: \( ^{24}C_5 = 42504 \). As we can only play cards costing 2 or 3 at the start of the game, this is also the number of starting hands from which we cannot play a card.
Given that we draw a hand at random out of the possible hands, the probability that we will draw an unplayable hand is the proportion of hands without 2 or 3 out of total hands out of the total number of hands, or mathematically:
\( \frac{42504}{658008} = 0.06459495933180144 \)
An alternative way to find the answer is the following:
The probability that the very first card we draw costs 4 or more is \( \frac{24}{40} \). Now we’ve taken out that card from the deck, the probability that the next card costs 4 or more is \( \frac{23}{39} \), and so on.
The probabilty that you draw five 4+ cost cards is therefore:
\( \frac{24}{40} \times \frac{23}{39} \times \frac{22}{38} \times \frac{21}{39} \times \frac{20}{36} = \frac{1771}{27417} = 0.06459495933180144 \)
I am interested in the strategies players use. Looking at player data, I see that 50% of players first play the highest-strength card they can. The remaining 50% play a card at random.
- A player intends to play the strongest card they can on their first turn. What is the liklihood that they play a card with a strength if 1? [ 2 marks ]
For this question we need to find the probability that we will draw a hand containing at least 1 strength 1 card and no strength 2 cards (other cards cannot be played anyway).
Total hands: \( ^{40}C_{5} = 658008 \)
Take out all cards costing 3 from the deck 32 cards remain, total hands that do not contains cards costing 3: \( ^{32}C_{5} = 201376 \)
Probability of drawing a hand with no cards costing 3: \( \frac{201376}{658008} = 0.3060388323546218 \)
Assuming we’ve drawn a hand with no cards costing 3 (i.e., we assume a 3 can’t be drawn, ), Prob of drawing a hand containing 1, assuming we’ve drawn a hand with no cards costing 3
\( \frac{8}{32} \) (1 on first card)
\( + \frac{24}{32} \times \frac{8}{31} \) (1 on second card)
\( + \frac{24}{32} \times \frac{23}{31} \times \frac{8}{30} \) (1 on third card)
\( + \frac{24}{32} \times \frac{23}{31} \times \frac{22}{30} \times \frac{8}{29} \) (1 on fourth card)
\( + \frac{24}{32} \times \frac{23}{31} \times \frac{22}{30} \times \frac{21}{29} \times \frac{8}{28} \) (1 on fifth card)
\( = 0.7889321468298108 \)
( could illustrate with a probability tree)
Probability they draw a hand with card costing 3 and they draw a 1
\(= 0.3060388323546218 * 0.7889321468298108 = 0.24144387302282036\)
An alternative approach is the following:
We need to find the liklihood of drawing a hand that satisfies 2 conditions:
- does not contain a strenth 2 card
- is playable
Without 2s in the deck there would be 32 cards. Therefore, the hands that do not contain a card of strength 2: \( ^{32}C_{5} = 201376 \)
The number of unplayable hands we found in an earlier question: \( ^{24}C_5 = 42504 \)
Unplayable hands are a subset of hands not containing strength-2 cards (i.e. all unplayable hands must lack a strength-2 card, otherwise they would be playable). Thus we can take away the number of unplayable hands from the number of hands not containing strength 2, to find hands that meet our two conditions above:
\( 201376 - 42504 = 158872 \)
We know from an earlier question, that the total possible hands is:
\( ^{40}C_5 = 658008 \)
Therefore, the liklihood of drawing a hand that meets our two conditions is:
\( \frac{158872}{658008} = 0.2414438730228204 \)
- A player intends to play a random card on their first turn. What is the liklihood they play a card with a strength of 2? [ 2 marks ]
We found earlier the probability of not being able to play with a starting hand \( \frac{^{24}C_5}{^{40}C_{5}} = \frac{42504}{658008} = 0.06459495933180144 \). The compliment of this gives us the probability of being able to play with a starting hand:
\( 1 - \frac{^{24}C_5}{^{40}C_{5}} = \frac{615504}{658008} = 0.9354050406681985 \)
If they play, they pick a random card out of all the cards they could possibly play first. There are 16 playable cards, of these 8 are strength 2. So the liklihood of playing a strength 2 card if they play is: \( \frac{8}{16} = \frac{1}{2} \)
Probability they can play and the play a strength-2 card: \( \frac{615504}{658008} \times \frac{1}{2} = \frac{615504}{1316016} = 0.46770252033409926 \)
- Visualise the following combinations of events with the aid of a probability tree and give their probabilities: [ 1 mark ]
- They used the random strategy and played a 1
- They used the highest-card strategy and played a 1
From earlier questions, we know:
\( P(play 1 | highest strategy) = 0.24144387302282036 \)
\( P(play 2 | random strategy) = 0.46770252033409926 \)
And as there are the same number of strength-1 and strength-2 cards in the deck:
\( P(play 1 | random strategy ) = P(play 2 | random strategy) = 0.46770252033409926 \)
Using the probabilities of 50% of using either strategy given in the question:
\( P(play 1 \cap random strategy ) = \frac{1}{2} \times 0.46770252033409926 = 0.23385126017 \)
\( P(play 1 \cap highest strategy ) = \frac{1}{2} \times 0.24144387302282036 = 0.12072193651141018 \)
-
Your opponent plays a 1. What is the probability that they used the highest-card strategy? [ 2 marks ]
From previous questions, we know some probabilities:
\( P(S_H) = P(highest strategy) = \frac{1}{2} \)
\( P(S_R) = P(random strategy) = \frac{1}{2} \)
\( P(P_1 | S_H) = P(play 1 | highest strategy) = 0.24144387302282036 \)
\( P(P_1 | S_R) = P(play 1 | Random) = 0.46770252033409926 \)
We can also recall Bayes’ Rule and the Law of Total Probability:
\( P(A|B) = \frac{ P(B|A) \times P(A) }{P(B)} \)
\( P(B) = \sum_{i}P(B \cap S_i) = \sum_{i} P(B | S_i) \times P (S_i) \)
Therefore:
\( P(S_H | P_1) = \frac{P (P_1 | S_H) \times P(S_H) }{ P(P_1 | S_H) \times P(S_H) + P(P_1 | S_R) \times P(S_R)} \)
\( = \frac{0.24144387302282036 \times \frac{1}{2} }{ 0.24144387302282036 \times \frac{1}{2} + 0.46770252033409926 \times \frac{1}{2} }\)
\( = 0.34047112878891783 \)
After analysing play data, I notice another common strategy. Water and ice cards combine well together, however water cards on their own tend not to be very effective. If a player has a ice card in their starting hand, they first play a water card 1/2 of the time. If they don’t have an ice card in their starting hand they first play a water card only 1/8 of the time.
-
A player plays water on their first turn. What is the probability they have a ice card in their hand? [ 3 marks ]
Total hands: \(^{40}C_5 = 658008 \)
Take out ice cards, 35 cards remain. Hands with no ice cards: \(^{35}C_{5} = 324632 \)
Probability of drawing an hand with no ice cards: \( P(I_0) = \frac{ 324632 }{ 658008 } = 0.49335570388201966\)
The compliment of this gives us the probability of drawing a hand with at least 1 ice card: \( P(I_{1+}) = 1 - 0.49335570388201966 = \frac{ 333376 }{ 658008 } = 0.5066442961179803 \)
From the question information, we know the probabilities that water will be played if there is ice in hand or no ice in hand:
\( P(P_W | I_{1+}) = \frac{1}{2} \)
\( P(P_W | I_0) = \frac{1}{8} \)
The question is asking us to find \( P(I_{1+} | P_W) \)
Recalling Bayes’ Rule and the Law of Total Probability:
\( P(A|B) = \frac{ P(B|A) \times P(A) }{P(B)} \)
\( P(B) = \sum_{i}P(B \cap I_i) = \sum_{i} P(B | I_i) \times P (I_i) \)
We can combine this as follows:
\( P(I_{1+} | P_W) = \frac{P(P_W | I_{1+}) \times P(I_{1+}) }{ P(P_W | I_{1+}) \times P(I_{1+}) + P(P_W | I_0) \times P(I_0) } \)
\( = \frac{\frac{1}{2} \times \frac{ 333376 }{ 658008 } } {\frac{1}{2} \times \frac{ 333376 }{ 658008 } + \frac{1}{8} \times \frac{ 324632 }{ 658008 }} \)
\( = \frac{\frac{1}{2} \times 0.5066442961179803 } {\frac{1}{2} \times 0.5066442961179803 + \frac{1}{8} \times 0.49335570388201966} \)
\( = 0.8042187130609311 \)
This is the end of the assessment.


